Technology
The Cloud Index is a system for predicting voting results based on the weather. By doing so, it hopes to be able to intervene in such events in the future using large-scale weather control.
The Cloud Index is built with a set of technologies called "artificial neural networks". Neural networks are networks created in computer software which mimic the brain structure of humans and animals. While neural networks have been around for more than sixty years, the last decade has seen a massive growth in their use, thanks to new designs and more powerful computers. They underpin the excitement in technology around machine learning: the design of computers to be able to learn to make decisions without being explicitly programmed with what to do.
Machine learning is not quite the same as artificial intelligence, but it can be applied to many of the tasks that we expect from artificial intelligence. These include - but are not limited to - recognising human faces and emotions, driving vehicles, writing newspaper reports, playing the stock market, translating languages, playing games, diagnosing diseases, recommending movies, and curating social media. Increasingly, machine learning is used to predict outcomes as well as to study them, and this connection between prediction and control, which underlies much contemporary technological politics, is crucial to the Cloud Index.
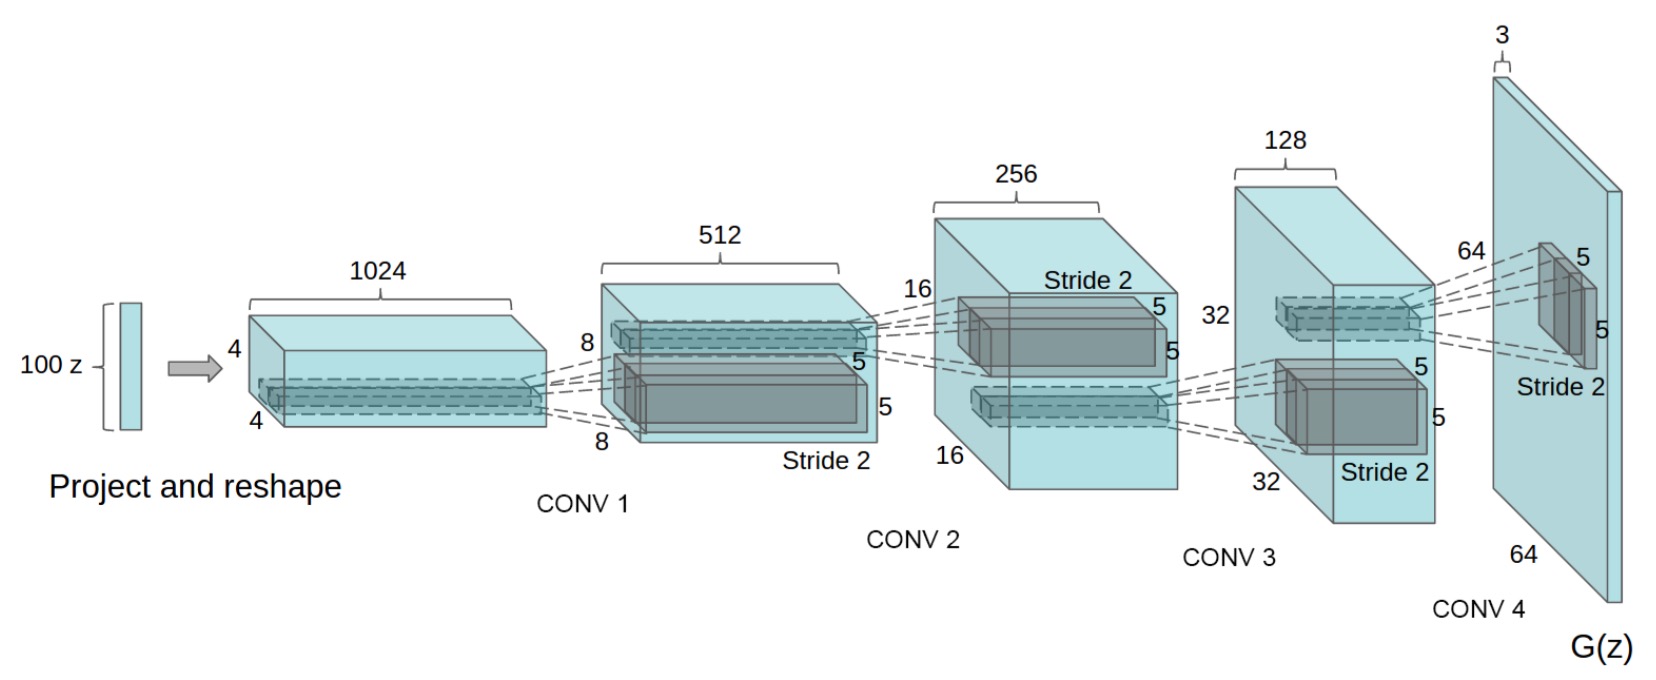
The Cloud Index neural network is of a kind called a DCGAN (deep convolutional generative adversarial network), which was first described in a paper in January 2016 by researchers from Facebook and Indico, a machine learning startup. The network runs on another piece of software called Tensorflow, which is the software used by Google for all of their machine learning - such as choosing search results, analysing photographs, and translating languages. DCGANs are a particular kind of neural network which work by training two separate networks, which compete with one another to improve their operation - hence, "adversarial". In this, they function much like an ideal democratic system, or a neoliberal market: through healthy competition, the best rises to the surface.

The Cloud Index's network has been trained on images. So in this case, one of the two separate networks in the DCGAN produces fake images of the kind we are searching for, and the other network tries to discriminate between the real and the fake. Once the training is complete, the network is capable of producing entirely new images on demand. In some sense, it knows what something looks like, and can draw new pictures of it. For example, in the image from the original paper shown above, the network was given thousands of pictures of bedrooms, and then was capable of producing pictures of new bedrooms on demand. And this is key: none of these bedrooms exist. They are pictures from a machine imagining what a bedroom could look like.
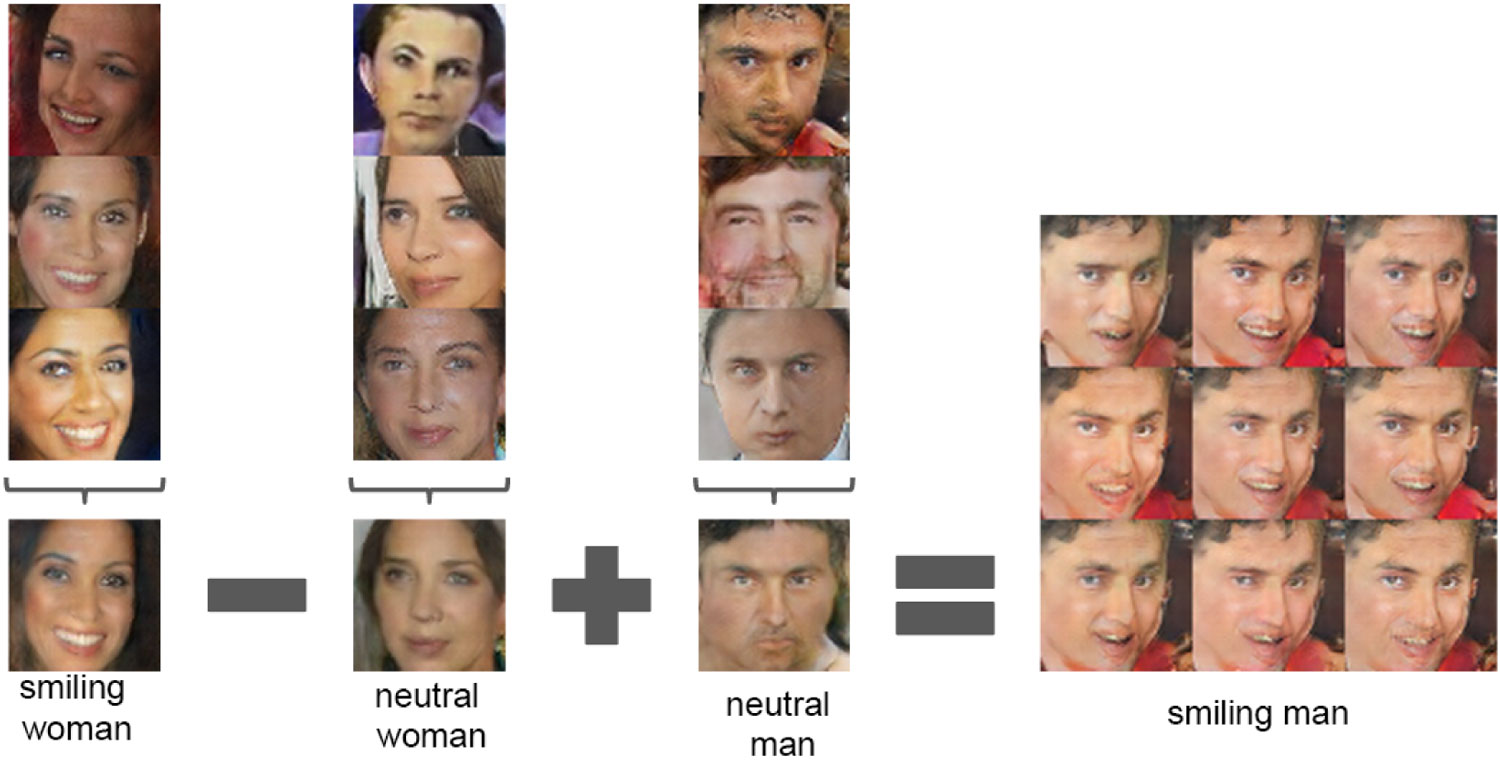
But the network can do more than this too. It does not merely look at images: it also arranges them, so it can start to understand the qualities of the image, what makes it unique, or part of a series; what shapes are important, what features are significant. Alongside the images, a wealth of structured data are provided: this is what this image is, these are the qualities it represents. For example, a network might be shown thousands of images of peoples' faces, together with a set of descriptors: this is a man, this is a woman, this one is smiling, this one is not. In another example, shown above, a network trained on labelled images of smiling men and smiling and non-smiling women can be asked to produce an image of a non-smiling man, even though it has never seen this particular combination. It can dream up new faces, and new expressions. It can do more than represent: it can predict.
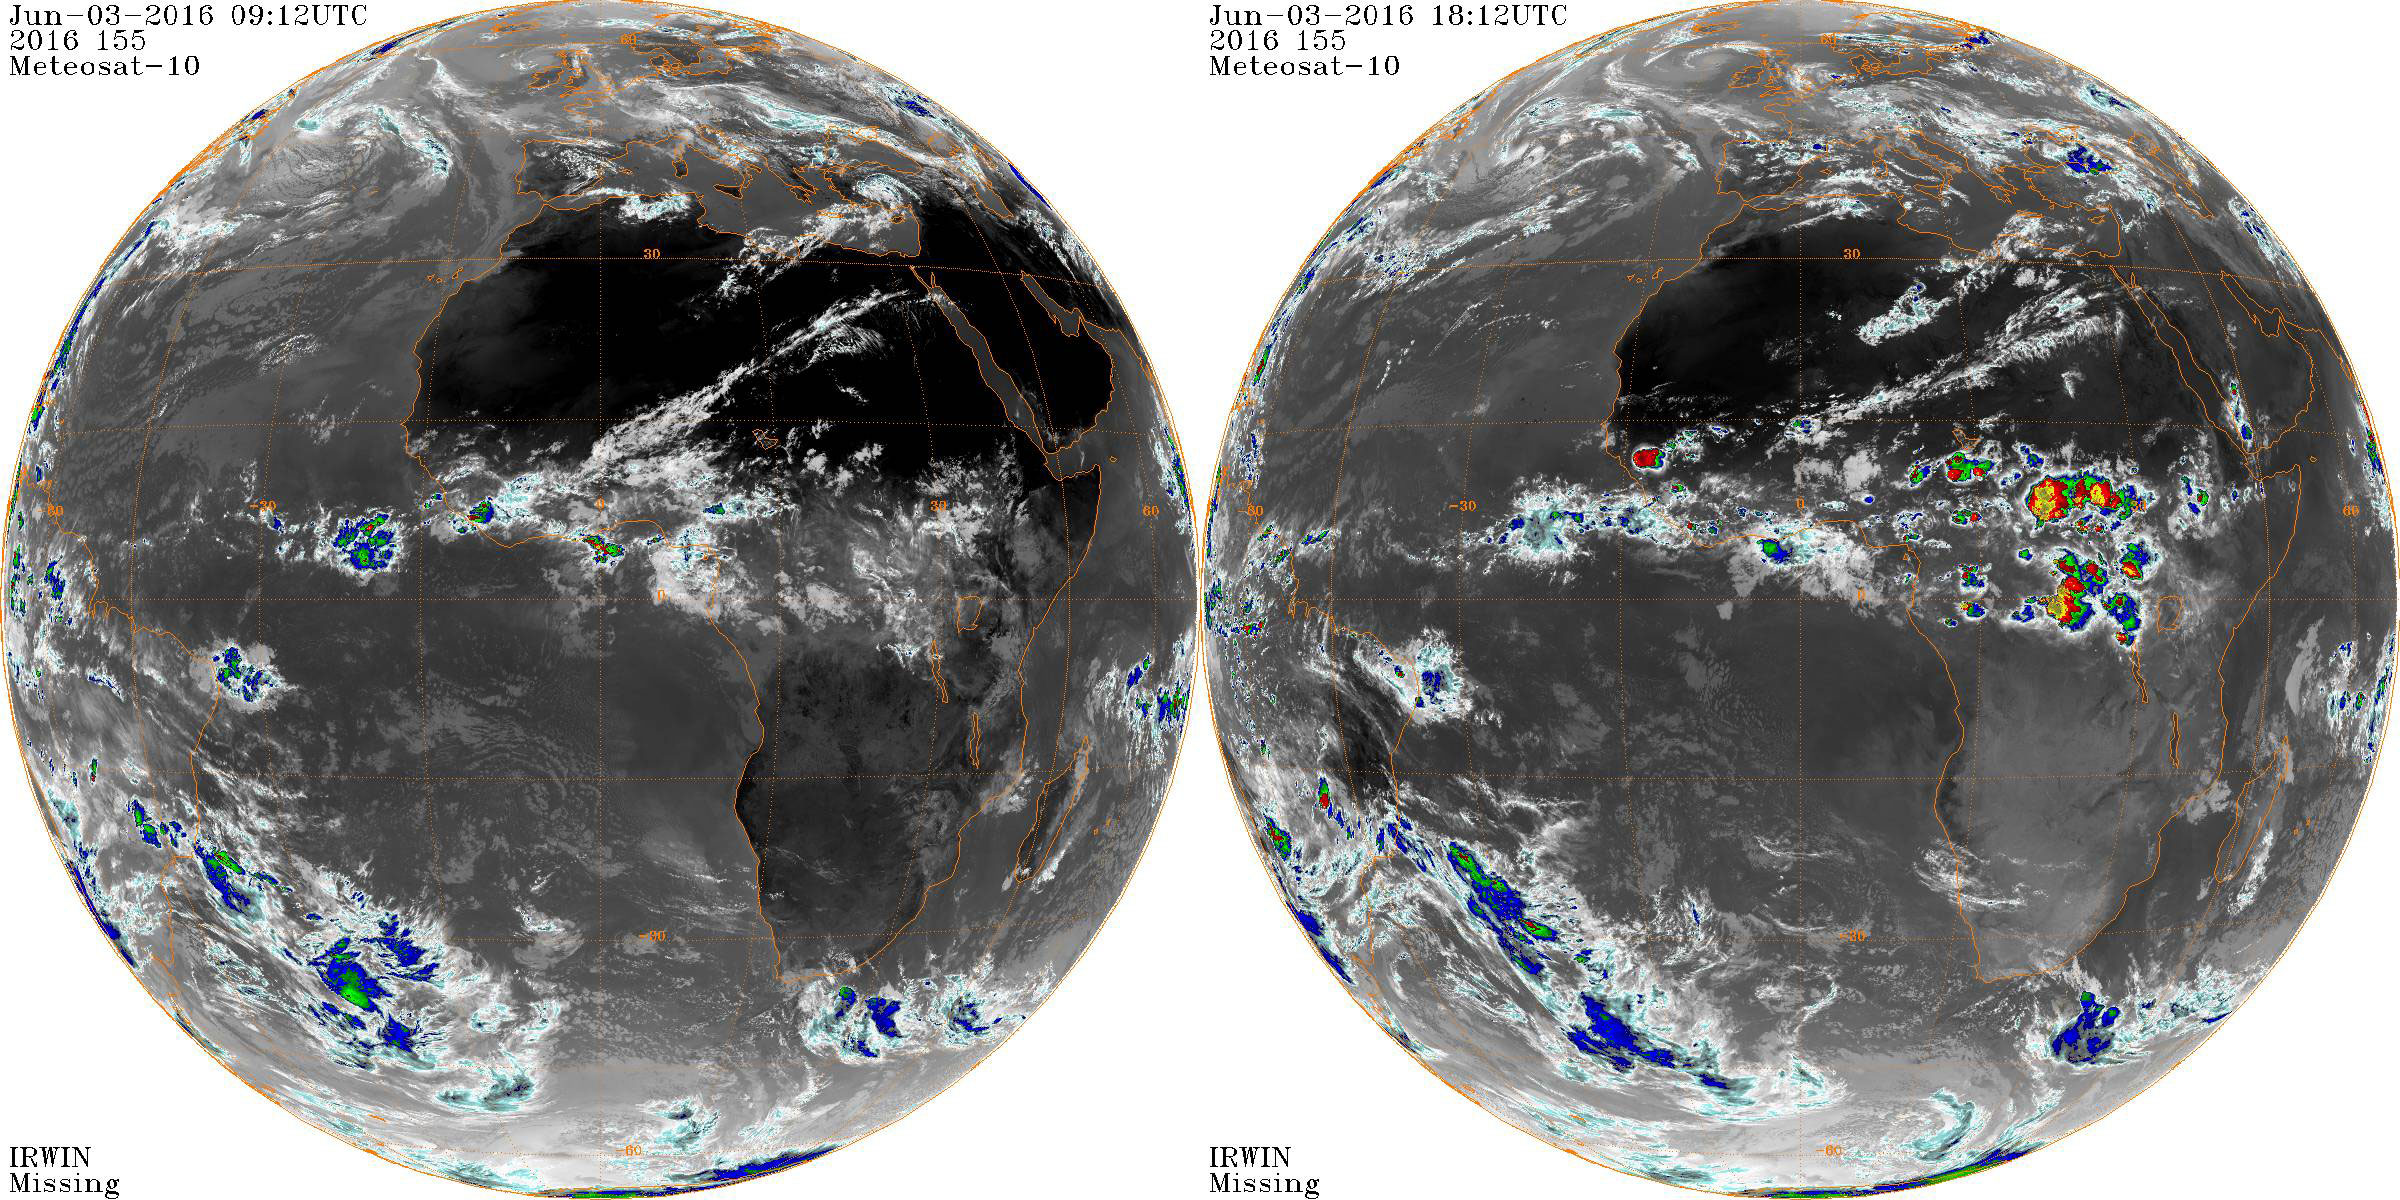
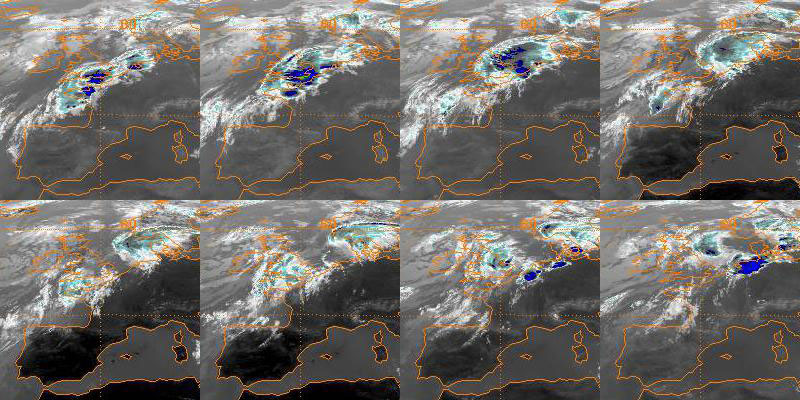
The Cloud Index was created to study weather patterns: specifically, cloud formations over the UK. To do this it was exposed to more than 15,000 satellite images of the UK gathered by Meteosat, a group of satellites operated since the 1970s by EUMETSAT, the European body responsible for meteorological satellites. All of these images are available online for free (as are many NASA images which were also used for testing). Full-disc infrared Meteosat images look like this, taken from the zero-degree point right above the equator:
The Cloud Index neural network was trained on these images and on six years of polling data. This data consisted of the stated voting intentions of the UK population in a European referendum. This data was gathered by the Financial Times from more than a dozen different polling organisations, to compile their Brexit poll tracker. (Although the Cloud Index used the figures as interpreted by the Financial Times, most of this information, together with that used by other newspapers, is pulled from Wikipedia). This data, for the last few years leading up to the referendum, looks like this:
(Throughout the Cloud Index, the colour Red is used to indicate Remain, the colour Blue for Leave, and the colour Green for undecided).
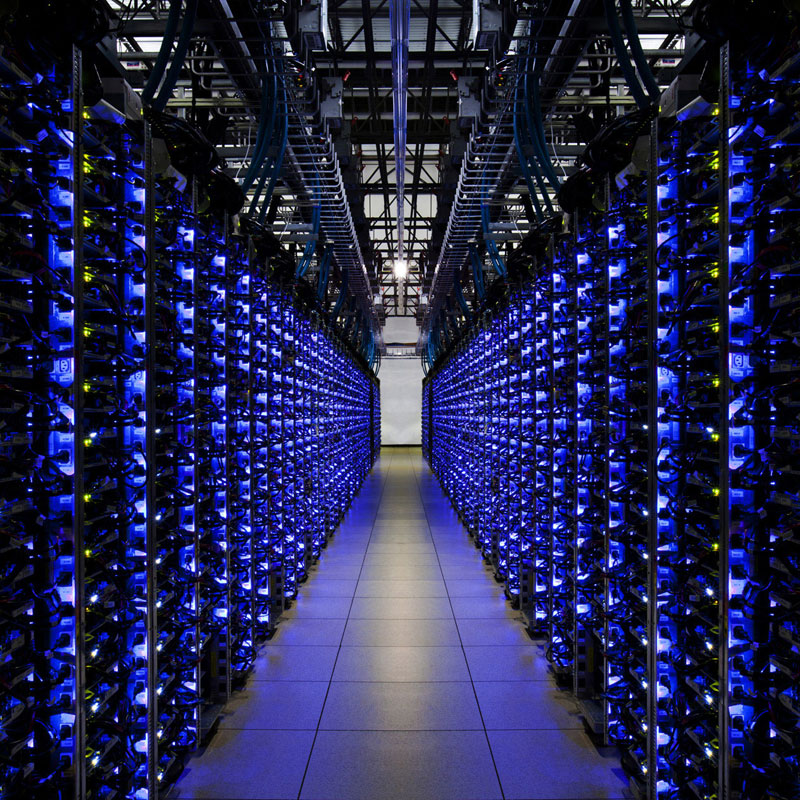
The network runs on Amazon Web Services, which is the computer infrastructure developed by Amazon to run its websites and now made available for anyone to run software on. This is "the cloud" - and it's much more powerful than an individual computer. One training run of the Cloud Index on a laptop would take a couple of weeks. On a small "instance" of Amazon's cloud - a single powerful server in a datacentre in Ireland - it takes around fourteen hours. (The version of Tensorflow Google released can only be run on a single computer, or instance. The version they use themselves runs across many, and so is exponentially more powerful).
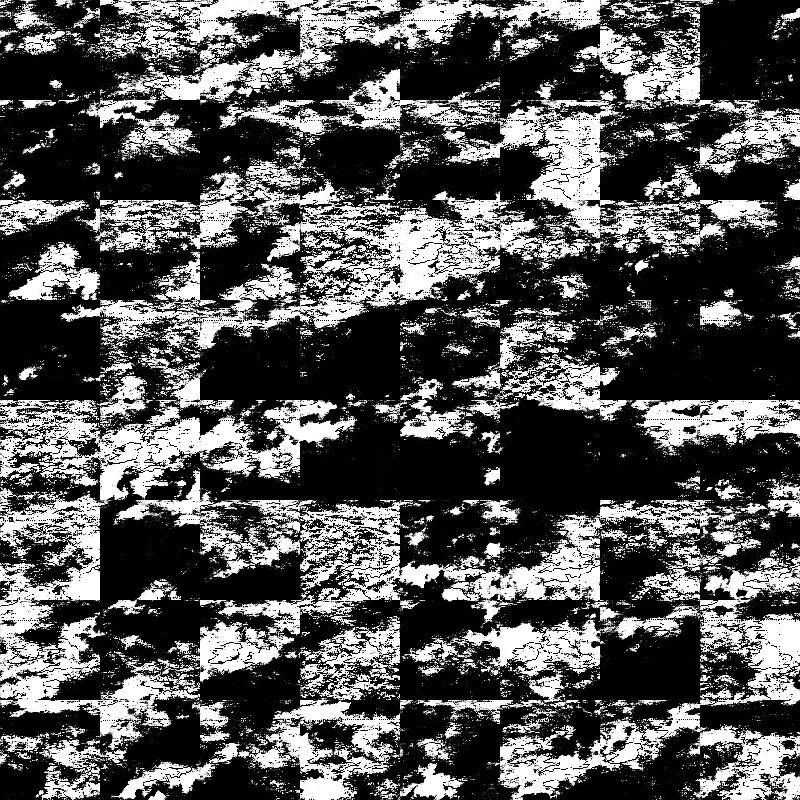
Even running on the cloud, this kind of processing is very expensive - financially and computationally. The Cloud Index was trained on small images to keep the time and costs under control, so the output is low resolution - but as the network is working at the scale of the country, with continent-sized clouds, this isn't too much of a problem. This is an example of sixty-four random images produced by the network when it was trained on patterns of cloud over the UK - while these images have been converted to black and white for greater clarity, the outline of the UK can be seen clearly in some of them; in others it's obscured by cloud. But these are not real cloud formations; rather they are what the network has learned cloud formations look like, and has learned well enough to draw new ones.
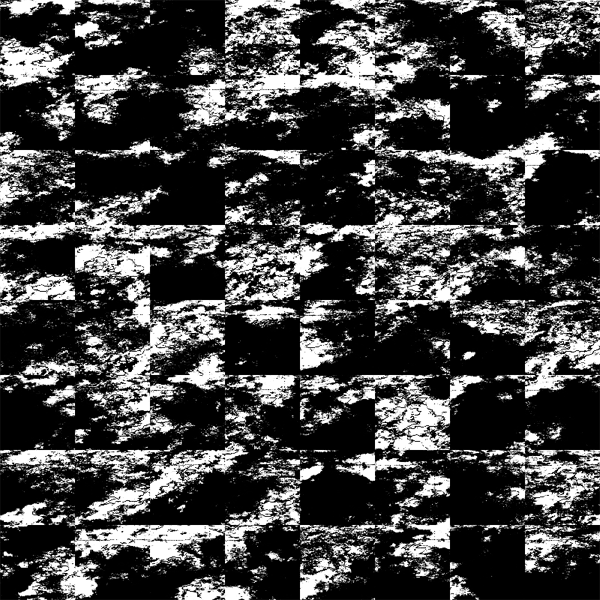
As with the facial arithmetic shown above, we can ask more of the network than simply producing new, random images. We can ask for representations of specific outcomes based on the data which it has associated with the images during training. For example, we can ask what the network would expect the weather to look like for a particular voting result. For example, here is the result interpolating across a range of possible outcomes for a vote of in the EU referendum (this training set used black and white images for greater clarity of coverage):
Once the network has been fully trained, we can compare it to known datapoints in order to determine its accuracy. Despite the relatively small amount of data the Cloud Index was trained on (high-level machine learning operates on millions or many millions of datapoints) the results are coherent for areas of the possibility space where we have consistent results - i.e. around the actual and predicted results.
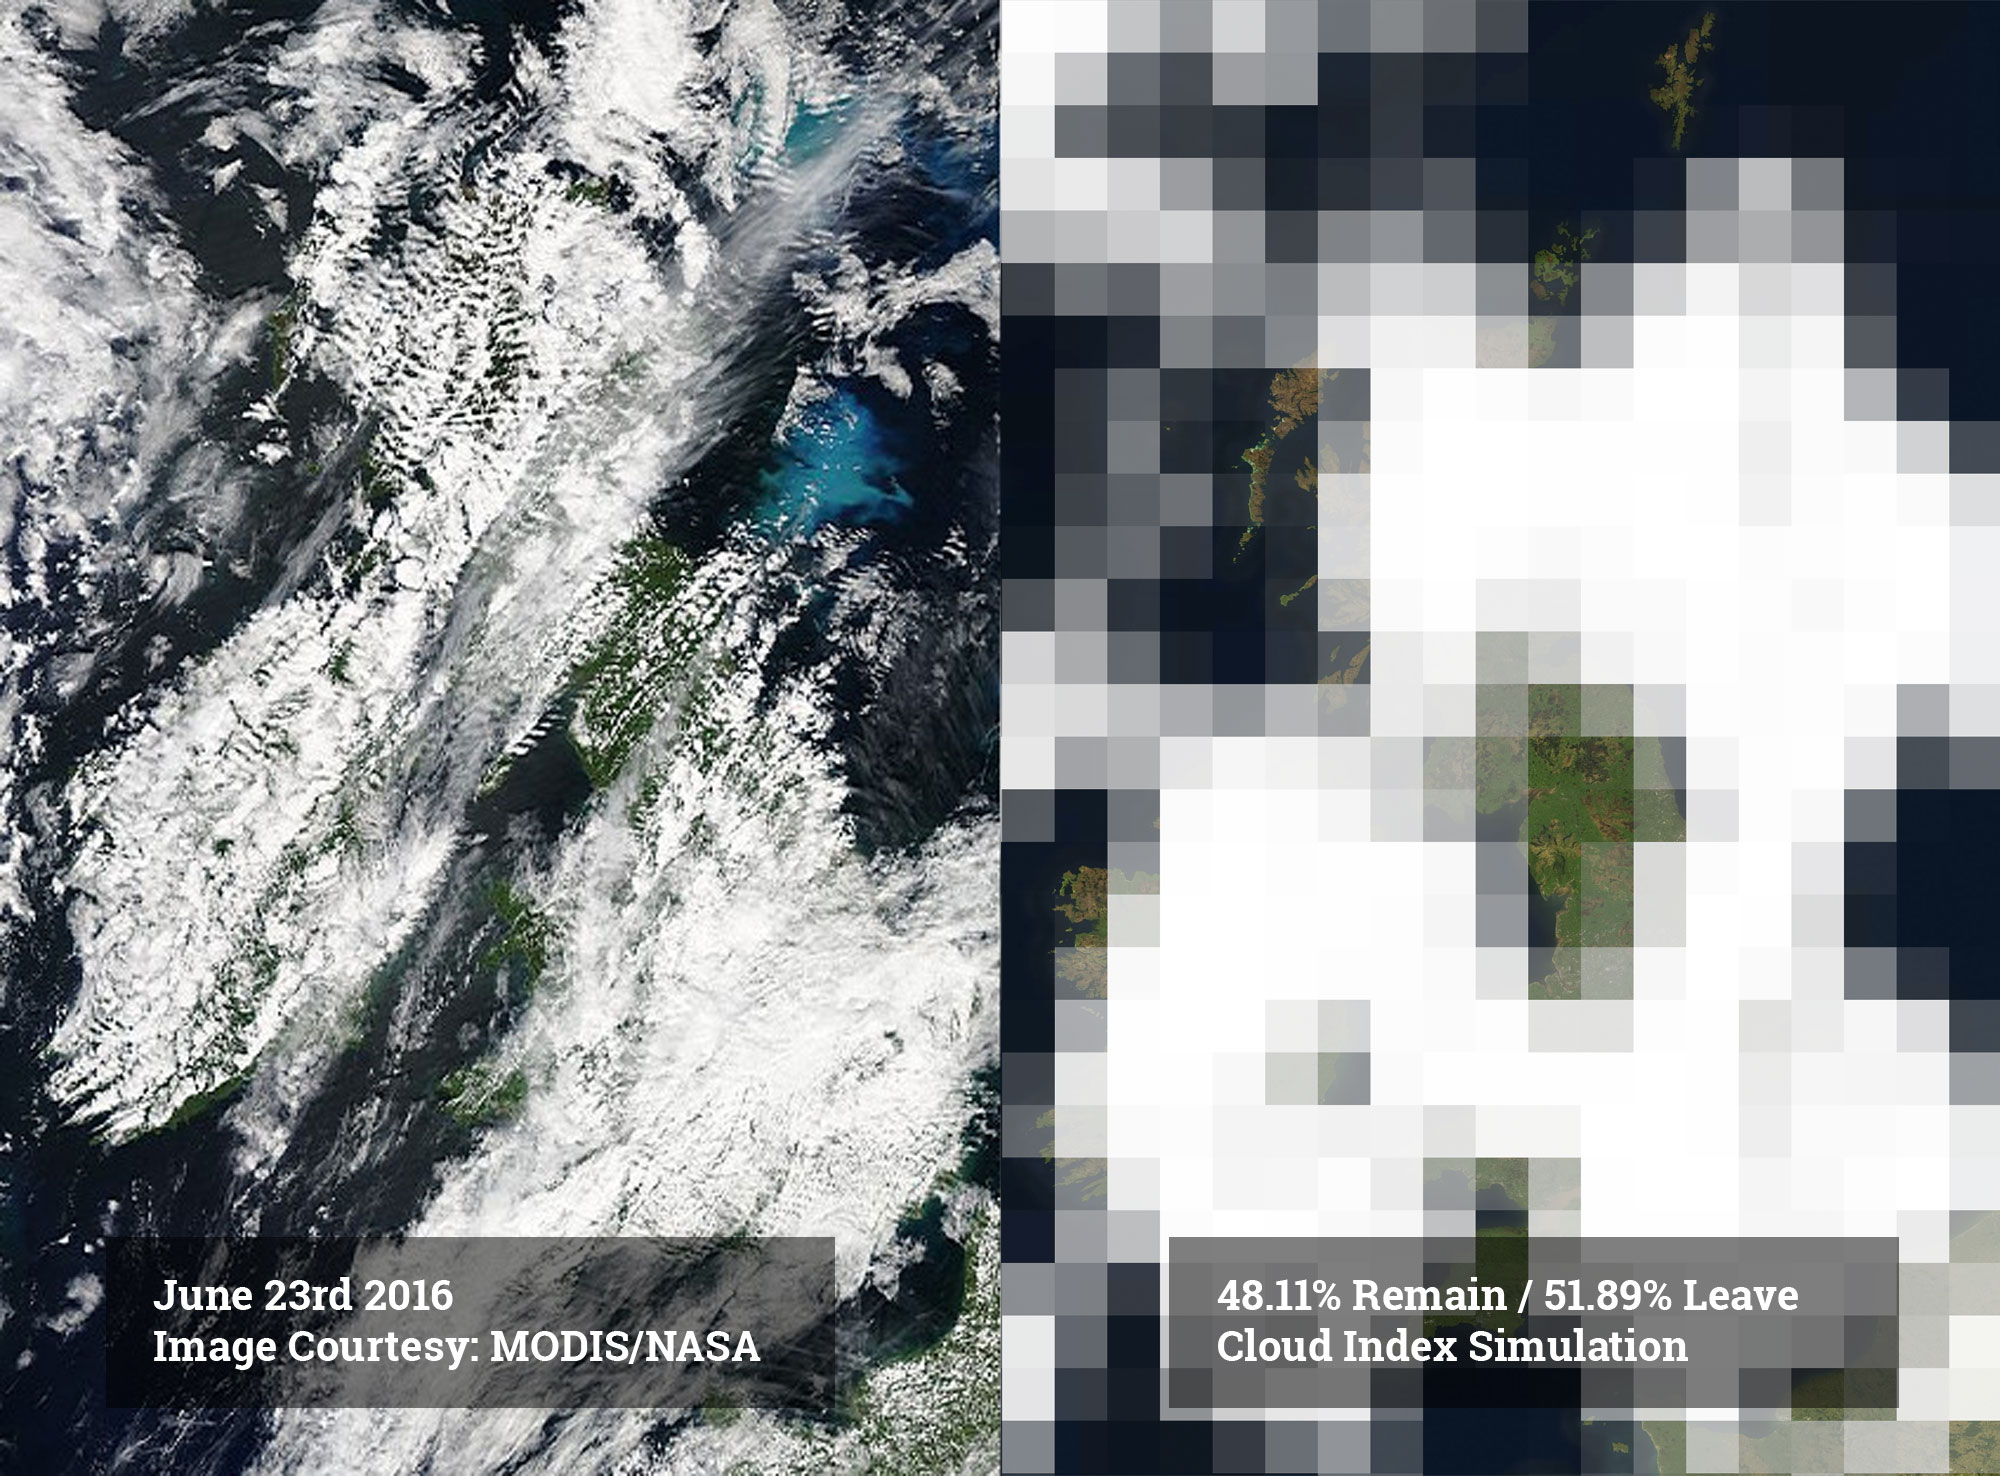
Here is the actual cloud coverage for Europe on June 23rd - the day of the referendum which produced that actual result:
And here is one of the many predictions made by the Cloud Index for such an outcome:
The purpose of the Cloud Index, however, is not to predict the past, or even the future, but to provide tools with which to intervene in the range of possible futures, and thus to guarantee certain outcomes. Such accuracy will require far greater levels of monitoring, a vastly increased volume of data gathering, as well as much higher resolution inputs and extended processing. Nevertheless, with the technology being developed and implemented today, we can, as in the examples given in the proposition, show how we might have intervened in the past.
The final two images are artistic renderings of simulations for the extreme end of the Cloud Index's range: votes where one side receives 100%. While these images are highly speculative, owing to the scarcity of actual data regarding such outcomes, they may be taken as a guide for future acts of intervention: seed the clouds here, disperse them there, and we might change the world.
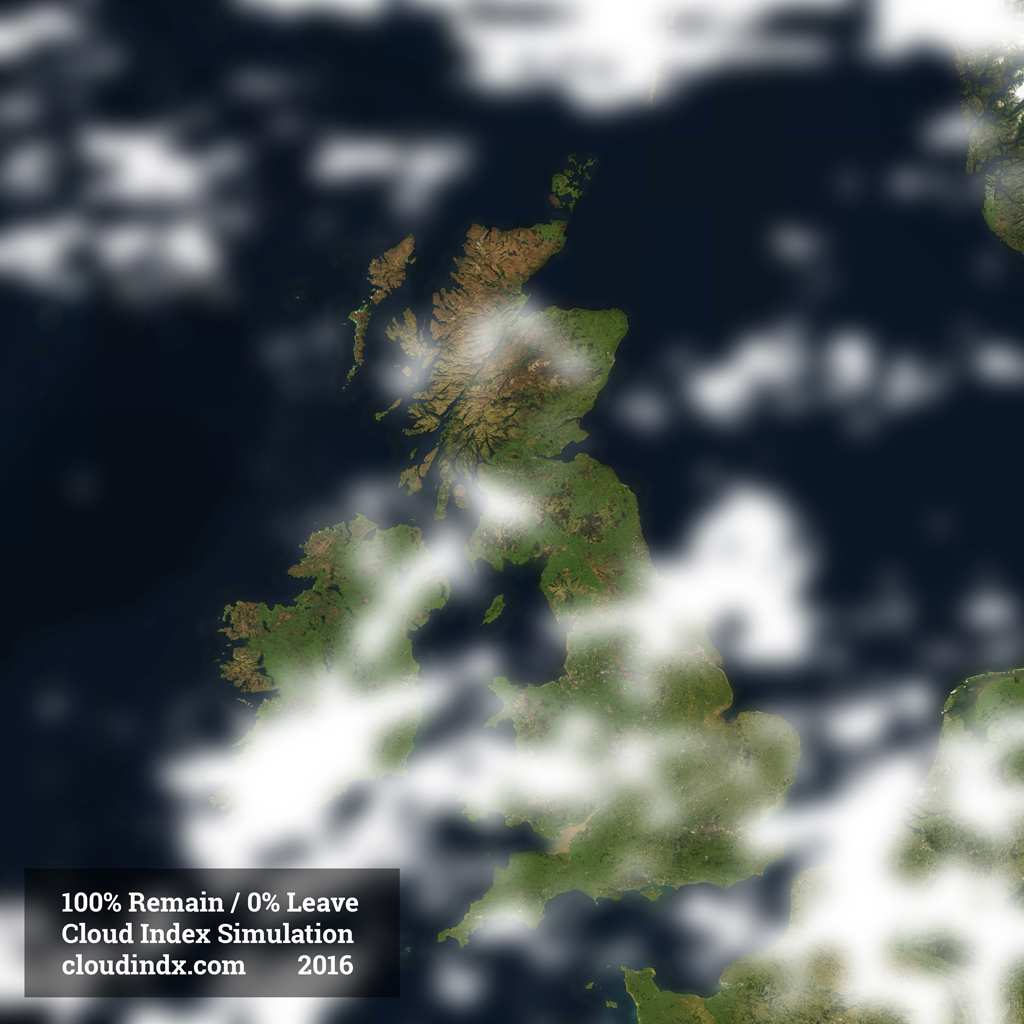
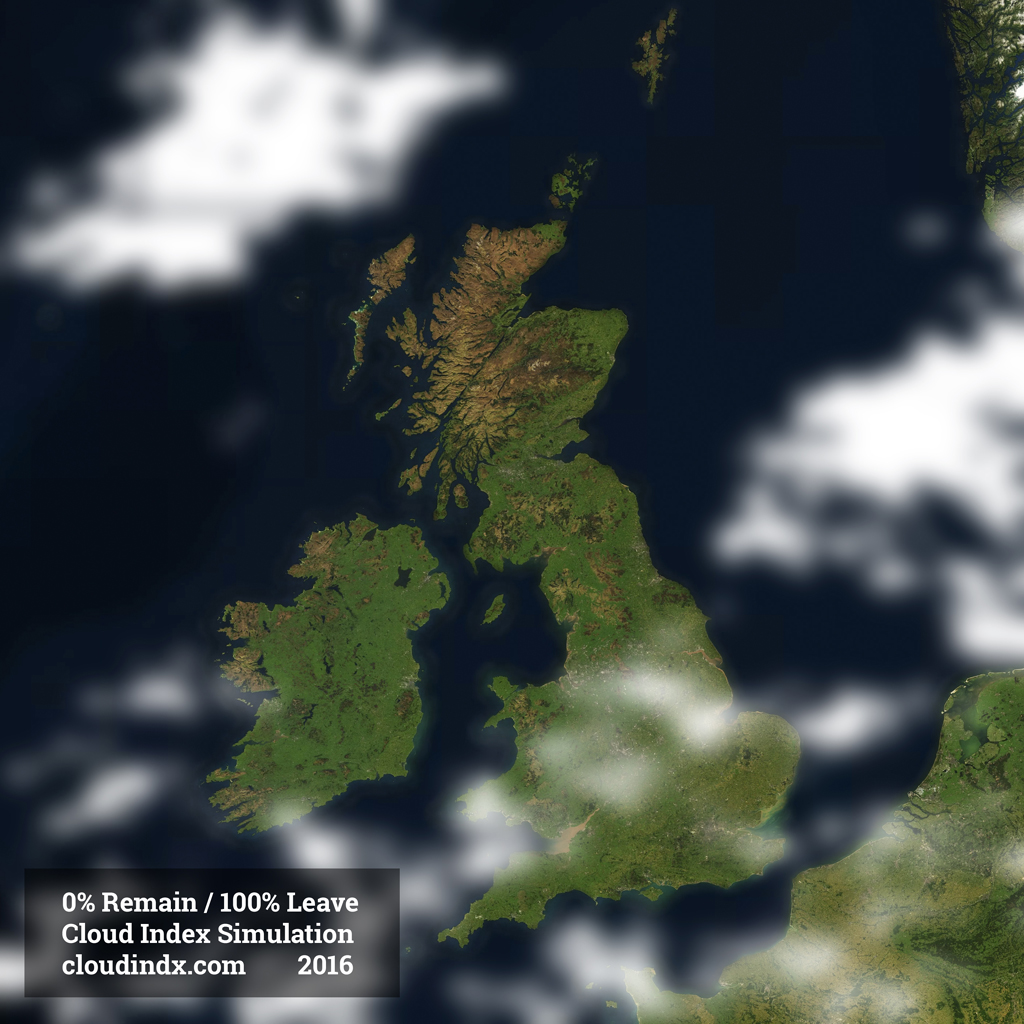
These are simulations selected from a much larger possibility space: further investigation and much more data is required to realise optimum conditions for weather simulation. However, they show a clear progression across the possibility space indicating a correlation between increased cloud levels for Remain polling versus clearer skies for Leave, investigations into which may correlate with other observations.
For more on the history of computation and weather control, which outlines the existing technologies which may assist in reaching this goal, read the history of the Cloud Index.
Commissioned by Serpentine Galleries
![]()
A project by James Bridle